n-curve Gaussian fitting with Gaussian mixture models
Here a copy of an answer I gave on stackoverflow
You can use Gaussian mixture models from scikit-learn:
from sklearn import mixture
import matplotlib.pyplot
import matplotlib.mlab
import numpy as np
clf = mixture.GMM(n_components=2, covariance_type='full')
clf.fit(yourdata)
m1, m2 = clf.means_
w1, w2 = clf.weights_
c1, c2 = clf.covars_
histdist = matplotlib.pyplot.hist(yourdata, 100, normed=True)
plotgauss1 = lambda x: plot(x,w1*matplotlib.mlab.normpdf(x,m1,np.sqrt(c1))[0], linewidth=3)
plotgauss2 = lambda x: plot(x,w2*matplotlib.mlab.normpdf(x,m2,np.sqrt(c2))[0], linewidth=3)
plotgauss1(histdist[1])
plotgauss2(histdist[1])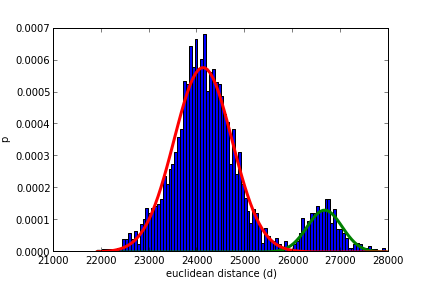
You can also use the function below to fit the number of Gaussian you want with ncomp parameter:
from sklearn import mixture
%pylab

def fit_mixture(data, ncomp=2, doplot=False):
    clf = mixture.GMM(n_components=ncomp, covariance_type='full')
    clf.fit(data)
    ml = clf.means_
    wl = clf.weights_
    cl = clf.covars_
    ms = [m[0] for m in ml]
    cs = [numpy.sqrt(c[0][0]) for c in cl]
    ws = [w for w in wl]
    if doplot == True:
        histo = hist(data, 200, normed=True)
        for w, m, c in zip(ws, ms, cs):
            plot(histo[1],w*matplotlib.mlab.normpdf(histo[1],m,np.sqrt(c)), linewidth=3)
    return ms, cs, ws